Developing a web application can be challenging; especially since it requires consistent monitoring, optimization, and development. What are the best tools that can aid you in this process?

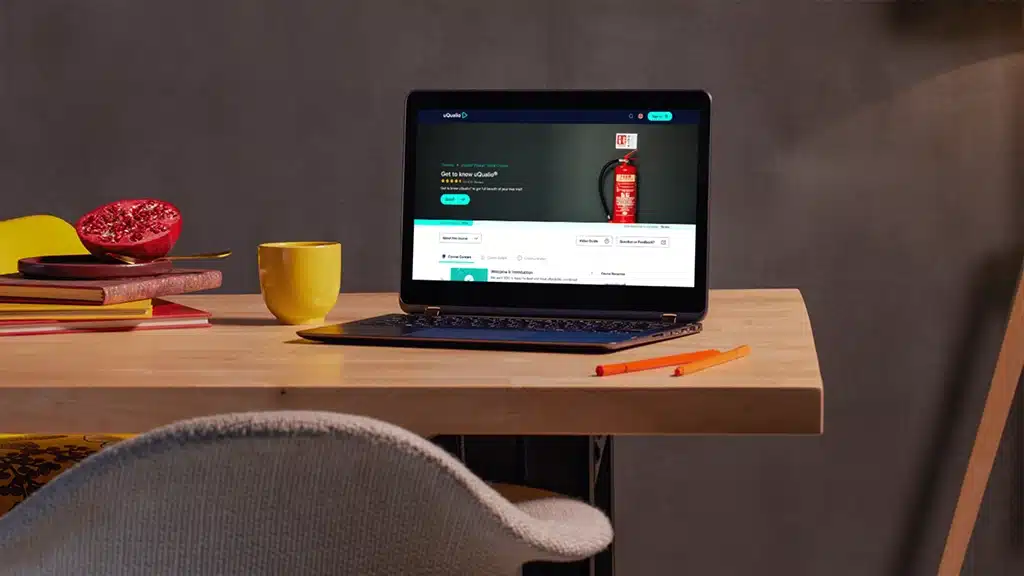
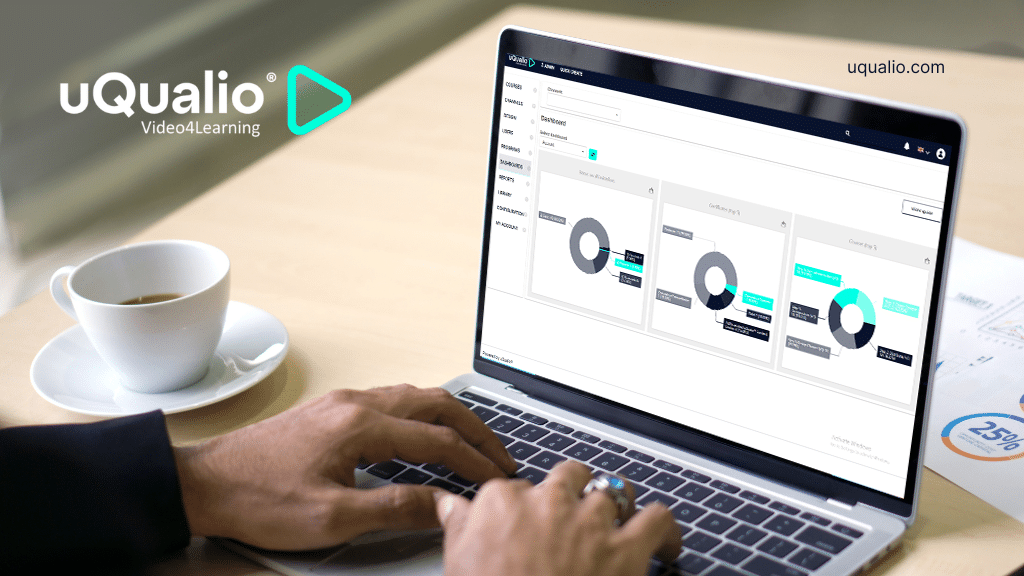
uQualio® is aneLearning authoring creation software based on a video bite-size microlearning approach and is a web application implemented as a 100% SaaS solution. It is like YouTube – but with gamified learning functionality .
Our end-user experience is heavily influenced by perceived performance. When people wait ‘too long’ the quality of the application is lower in the eyes of the user even if the app works as expected.
Recently I was asked what tools we use to optimize and monitor the performance of uQualio®. I would like to share a longer version of the answer with you. It may inspire you and give you a perspective on what you can do.
My experience web application performance (and performance measurement and tuning in general) are:
- You cannot rely on just one tool
- You must monitor short- and long-term trends with moving averages and absolute execution times
- Think before you go for one or the other proposed performance improvement solution
- Measure before and measure after to verify if it was an improvement or not
- ‘Premature Optimization Is (STILL) the Root of All Evil’, Donald Knuth, [‘still’ is my corollary]
Scope
As a web application, we keep an eye out for performance creep. This does not happen overnight, but at some point, we see the application slow down to a degree where the users notice. We use multiple tools to monitor performance. No tool shows the correct view on performance. End user-perceived performance is a good starting point, but it must be supplemented by more angles to decide where and what to do.
In addition to feedback from our QA staff, our colleagues, and customers we use a couple of tools to measure and monitor uQualio®’s performance.
The three main tools are:
- Leapwork – no-code automation platform
- Google web.dev
- Amazon Web Services RDS Database monitoring and database logs
Leapwork
Leapwork is the automation platform we use for regression testing in our development environment and our staging environment. Leapwork helps us in two ways to keep track of performance:
- Each step in a test flow is linked to a time-out. In most cases, we run with the default time-outs. For a few steps, we have extended to a longer time out. The test fails with a time-out error and then our QA analyst checks if we have a case of decreased performance.
- Flow execution time – total time to run each set of tests. Our number of test flows is constant, so we compare run times to see trends over weeks and months.

Here you see an extract of the flow executions in Leapwork. The flow “QA5 Login …” seems to be around 28-29 seconds when successful, in some cases, it takes a few seconds longer and it times out at 39-40 seconds when the flow fails.
Google web.dev (Lighthouse)
Google has the serviceweb.dev which gives you insights into how your application loads and performs (aka. Lighthouse). A couple of times per month we check the number and compare it with the previous executions to check how we perform. Any regression that is not back on or above the running average is being addressed in the next sprint or two.
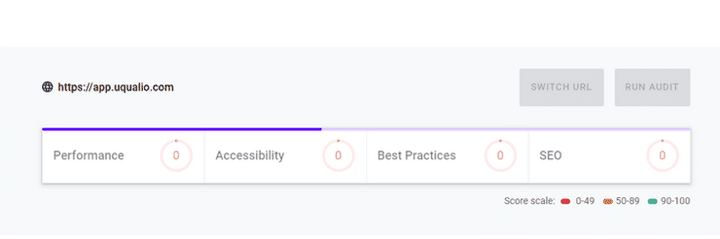
The advice and suggestions are good and relevant. A few are very simple to implement. More of web.dev’s suggestions address structure and platform, which are harder to change in our agile development process.
We record the changes and ensure that the total web.dev score does not decrease over time. On ‘Performance’ we have some work to do in order to improve perceived and real performance.
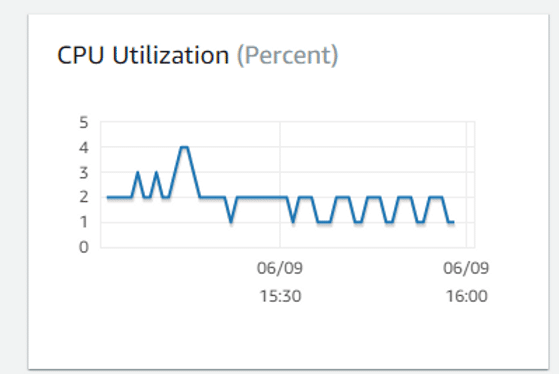
Amazon Web Services and database logs
Our databases run on Amazon Web Services (AWS).
We have set up alerts if the CPU consumption is above 50% within each measurement. This gives an indication of any long-running, high consumption usage, or high activity on the database. We analyze the log to check if a single query or two is responsible for this. Then we can simulate and rerun the queries to optimize as needed.
Simple and useful tools that help us keeping end user-perceived performance in place.
So far, these basic features have been enough for us. We know about more advanced settings and alerts offered by AWS, but currently, we are satisfied with what we get.
Summary Maintaining performance in a web application like uQualio® is an ongoing task. You are never done with performance, so you have to monitor and check changes in the short and longer-term. Basic tools like web.dev and AWS database alerts combined with an automation platform like Leapwork work well for us in the daily monitoring.
Interested in what a web-based video eLearning platform with gamification elements can do for you or your business?
Start Free Your Trial | Know more about uQualio | Case Study | Book a Demo | CEO Advice | Video4Learning | Training through uQualio | Fremko